On this page
A good Power BI alternative depends on who makes the numbers and who looks at them. For marketing numbers from Google, Data Studio is free. For a team that asks questions of its own database there is Metabase, which is open source. For an analyst with a big budget, Tableau. And when many people need to look, or the numbers come from your own software, a custom dashboard often pays for itself, because you pay no licence per viewer.
Power BI itself is not a bad package. In the Microsoft world it is the standard, and for anyone who thinks in Excel the step is small. But every user who opens a shared report generally needs a Pro licence, at 12.10 euros a month at Belgian list prices, and Premium features cost 20.80 euros per user. What that adds up to is in the guide on Power BI pricing.
What Power BI licences cost per year
5 users
Pro
726 euros a yearPremium Per User
1,248 euros a year15 users
Pro
2,178 euros a yearPremium Per User
3,744 euros a year40 users
Pro
5,808 euros a yearPremium Per User
9,984 euros a year
Licence costs per year excluding VAT, on a yearly plan, at Belgian list prices. Someone who only views a report also needs a licence, unless the reports sit on a Fabric capacity of F64 or larger. Building, connecting and maintaining the reports comes on top.
Power BI Pro against the alternative, for fifteen users
Per year, three people who build reports and twelve who view, list prices excluding VAT. Building and maintaining the reports comes on top in every column.
- Marketing numbers from Google
- Power BI Pro2,178 euros, fifteen licences
- The alternativeData Studio: 0 euros, Pro with management per project around 9 dollars per user per month
- Questions to your own database
- Power BI Pro2,178 euros, fifteen licences
- The alternativeMetabase: 0 euros self-hosted, Starter in the cloud around 1,730 dollars a year
- Deep analysis by an analyst
- Power BI Pro2,178 euros, fifteen licences
- The alternativeTableau: three Creators and twelve Viewers, around 4,860 dollars a year
- Many viewers, numbers from your own software
- Power BI Proevery viewer a licence of 145.20 euros a year
- The alternativeCustom dashboard: the build price, no licence per viewer
Power BI stays the logical choice for a team that works in Microsoft 365 and wants to build its own reports. Teams that mostly look, or that pull their numbers from their own platform, pay Power BI for flexibility they do not use.
Power BI alternatives by situation
Your numbers live in Google: Data Studio
Data Studio is Google's free reporting tool. Until April 2026 it was called Looker Studio; Google then gave it back its old name. Existing reports carried on as before.
Its strength is the link with Google Analytics, Google Ads, Search Console and Google Sheets. A monthly marketing report takes an afternoon. Sharing works like a Google document: with a link, without a licence per viewer. For a team that wants management and rights per project there is Data Studio Pro, at around 9 dollars per user per month.
Its weakness: as soon as you want numbers from your own accounting, ERP or scheduling, you need a step in between, often a spreadsheet or a paid connector. And with a lot of data it gets slow.
You have your own database: Metabase
Metabase is open source. Host it yourself on a server and you pay no licence. In the cloud, Starter costs 100 dollars a month for the first five users and 6 dollars per extra user; Pro costs 575 dollars a month for ten users. A yearly plan takes ten percent off.
Its strength is that someone without SQL can ask the database a question: how many orders per customer this month, filtered by region. Anyone who knows SQL writes the question themselves. For a company with its own platform and a technical person in house it is often the best value.
Its weakness: someone has to run the server, do the updates and manage access. And your team needs to know where which numbers sit in the database.
You have an analyst and a budget: Tableau
Tableau is the heaviest package on this list. You pay per role: a Creator who builds reports costs 75 dollars a month, an Explorer who edits existing reports 42 dollars, and a Viewer who only looks 15 dollars, each per user on a yearly plan.
For an analyst who digs into the data and makes charts that convince a management team, it is strong. For a small business without an analyst it is often more package than you need.
Many viewers, numbers from your own software: a custom dashboard
A custom dashboard is not a reporting tool but a screen in your own software or a separate web app. It shows the numbers your team decides on, straight from the source, and every viewer signs in without a licence. How that works is on custom dashboard development.
Where a reporting package pinches
A package such as Power BI, Tableau or Metabase is built to look at data. That is not the same as using it. Three situations where the difference starts to count.
A number has to lead to an action. A report shows that three inspections expire this month. Then someone has to open another program to book them. In a dashboard inside your own software you click the inspection and schedule it on the same screen.
Everyone needs to see a slice. A driver sees their trips, a team lead their crew, the owner everything. In a package that means a licence per viewer and row-level rights someone has to maintain. In your own software it follows from who signs in.
The numbers come from many sources. Accounting, scheduling, CRM and a few spreadsheets. In a package you build a connector per source and hope it keeps working. In your own platform you bring the data in once through API integration services, and it is ready for every screen.
What we built ourselves
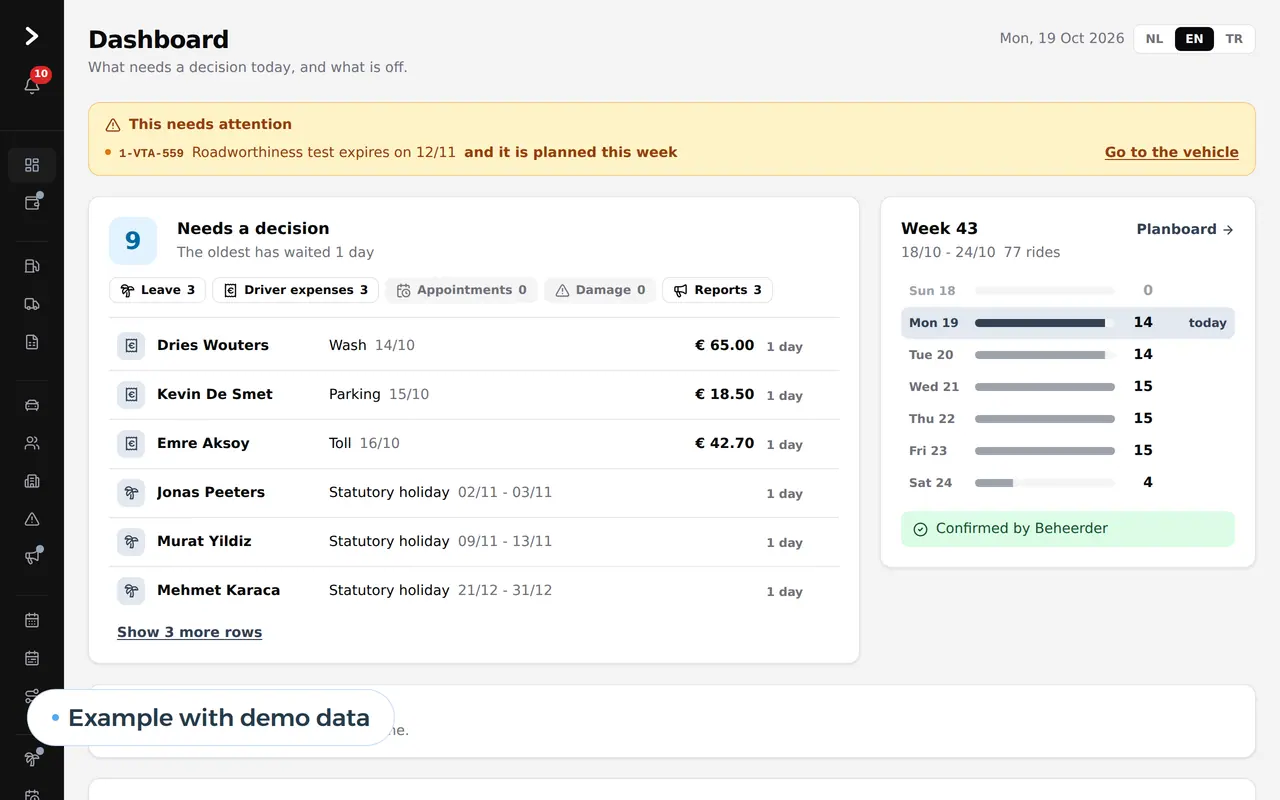
For a Belgian transport company we built a platform for fuel, fleet and scheduling. In the office it opens on a dashboard that shows what needs a decision today, with the trips per day beside it. For customs it produces a discrepancy report of the fuel stock, and for the fleet a fleet report. Those numbers do not sit in a separate reporting tool but in the platform itself, where the work happens. The full story is in the DA Logistics case.
When a custom dashboard replaces Power BI
When the numbers belong in your own software.
- Which numbers decideWe look at which reports your team really opens, and which decision follows each time.
- Connect the sourcesAccounting, scheduling, CRM: we bring the data in once and keep it up to date.
- A screen per roleEach role gets its own start screen, with the numbers and the button to the next step.
- Side by sideFor a month the report and the dashboard run together. Once the numbers match, the licence stops.
Power BI, alternatives and custom side by side
| Power BI | Data Studio | Metabase | Tableau | Custom dashboard | |
|---|---|---|---|---|---|
| Licence | Per user per month | Free, Pro per user | Free self-hosted, cloud per month | Per user per role | None, a build price |
| Viewers without a licence | Only on a large Fabric capacity | Yes, with a link | Yes, self-hosted | No | Yes |
| Strong at | Excel users, Microsoft 365 | Google marketing data | Questions to your own database | Deep analysis | Numbers that lead to an action |
| Who builds the reports | A power user or consultant | A marketer | A technical person | An analyst | Us, together with your team |
| Runs on Mac and in the browser | Building on Windows only, viewing in the browser | Browser | Browser | Mac and Windows | Browser and phone |
Power BI Desktop, the version you build reports in, runs only on Windows. That is one of the reasons teams on a Mac look for an alternative.
Moving away from Power BI
A move starts with an inventory: which reports are really opened, by whom and how often? In most companies that is a small share of what was built. Those reports you rebuild in the alternative; the rest you let go.
The data itself does not move, because it sits in your sources. What does have to move are the calculations. In Power BI they live in DAX formulas, and someone has to translate them into SQL or into the logic of your new package. Allow time for that.
Plan the move before your yearly licences renew, and run both side by side for a month. That way you see whether the numbers match before anyone misses the old report.
Licences per year at 5, 15 and 40 users
What the licences cost per year, by the number of people who open a shared report. List prices excluding VAT, without building and maintaining the reports.
| Users | Power BI Pro | Power BI Premium per user | Data Studio | Data Studio Pro | Custom dashboard |
|---|---|---|---|---|---|
| 5 | 726 euros | 1,248 euros | 0 euros | around 540 dollars | No licence, a build price |
| 15 | 2,178 euros | 3,744 euros | 0 euros | around 1,620 dollars | No licence, a build price |
| 40 | 5,808 euros | 9,984 euros | 0 euros | around 4,320 dollars | No licence, a build price |
With Power BI the bill grows with every viewer, including someone who opens a report once a month. With a custom dashboard an extra viewer changes nothing about the licence. How the build price comes about is in the guide on Power BI pricing.
Leaving Power BI, or staying
What is a free alternative to Power BI?
Google's Data Studio is free and shares reports with a link. Metabase is free if you host it yourself. Power BI Desktop is free too, but sharing with colleagues needs a licence.
Is there an open source alternative to Power BI?
Yes. Metabase and Apache Superset are open source. You host them yourself, so you pay no licence but you do run the server.
What do you use on a Mac instead of Power BI?
Power BI Desktop runs only on Windows. Data Studio, Metabase and a custom dashboard work in the browser, and Tableau has a Mac version.
Is Tableau better than Power BI?
For deep analysis by an analyst it often is. For a small business that works in Microsoft 365, Power BI is cheaper and quicker to set up.
When does a custom dashboard pay off instead of Power BI?
When many people need to look, the numbers come from your own software, or you want to act straight from a number. Then you pay no licence per viewer.
More on numbers and software
What a KPI is and which ones to pick is under KPI. If you are torn between renting a package and having something built, read the trade-off in build vs buy software and what SaaS means exactly. If your team builds internal screens in a low-code tool, see Retool alternatives. If you mostly work in spreadsheets today, Excel vs Airtable may already be enough.
Work out what a custom dashboard costs with the software development cost calculator; how custom work is priced is in the guide on custom software development cost. We build the dashboard as a web application. Want to know which alternative fits you? Get in touch.