On this page
- 01PDF, photo or web page: how 4,983 venue sites show their menu
- 02Limburg and the bars stand out
- 03How to put your restaurant menu online
- 04The cost of a pint in Belgium: €3.10 on 396 menus
- 05What you get for that money: 25 cl, not 568 ml
- 06By province, prices sit close together
- 07How much weight the Brussels gap can carry
- 08Bars ask €3.00, restaurants €3.30
- 09The price of a plate of spaghetti bolognese
- 10Coffee stays near €3 everywhere
- 11Provincial capitals: no measurable premium
- 12Are these prices current?
- 13The national index tells a different story
- 14How this sits beside our earlier research
Of the 2,734 Belgian bars and restaurants where we found a menu on the venue's own website in November 2026, 912 show it only as a PDF or image: 33.4%. For 395 of them it is a photo, a scan or a flipbook with no text. A guest on a phone then has to open a file or zoom in, and a menu without text is unreadable for a search engine or a screen reader.
Limburg stands out at 43.7%, and bars at 41.4% against 31.4% for restaurants. In Flanders 35.2% of the menus found sit only in a PDF or image, in Wallonia 25.2%. On the menus we could read we also logged prices: a draught pils costs a median of €3.10, spaghetti bolognese €17.50 and a cup of coffee €3.20.
A web page is the largest group, 1 in 3 menus found is only a PDF or image
Prices on a web page
36.6% (1,822)Only in a pdf with text
10.4% (517)Only in a pdf without texta scan or photo
0.8% (39)Only as an imagephoto or embedded viewer
7.1% (356)Menu page without prices
9.3% (462)No menu foundwithin five pages
31.6% (1,576)Link found, page not read
4.2% (211)
Share of all hospitality sites we could read, November 2026.
PDF, photo or web page: how 4,983 venue sites show their menu
On 1,822 sites the menu and its prices sit on an ordinary web page: the largest group, 36.6% of all sites we read. Next comes the group where we found no menu within five pages. That does not mean those venues have none: it may sit deeper in the site, on a social network or with a delivery platform.
| How the menu appears online | Sites | Share of 4,983 |
|---|---|---|
| Prices on a web page | 1,822 | 36.6% |
| Only in a PDF with text | 517 | 10.4% |
| Only in a PDF without text | 39 | 0.8% |
| Only as an image or flipbook | 356 | 7.1% |
| Menu page without prices | 462 | 9.3% |
| No menu found within five pages | 1,576 | 31.6% |
| Link found, page not read | 211 | 4.2% |
A program can still read a PDF with text, but not a photo or a scan. On 395 sites, or 7.9% of all 4,983, the menu exists only in that form. A site only counts as PDF or image when we found its prices nowhere as text on a page. We checked 50 sites by hand: 45 were right, and the errors leaned towards the web page. The real share of menus in a PDF or image is therefore likely a little higher than we report.
Limburg sits above the national figure, 43.7 against 33.4 percent
Belgium 33.4%
Limburg100 of 229 menus
43.7%West Flanders177 of 465 menus
38.1%Flemish Brabant102 of 297 menus
34.3%Antwerp185 of 554 menus
33.4%Brussels96 of 301 menus
31.9%East Flanders152 of 491 menus
31.0%Hainaut21 of 74 menus, under 100
28.4%Liege39 of 140 menus
27.9%Walloon Brabant20 of 88 menus, under 100
22.7%Namur13 of 59 menus, under 100
22.0%Luxembourg7 of 36 menus, under 100
19.4%
Percent of the menus found per province, November 2026.
Provinces with fewer than 100 menus found are shown without a conclusion.
Limburg and the bars stand out
Limburg sits above the national figure at 43.7%. Its interval of 37.4% to 50.1% sits entirely above that of Belgium as a whole, which runs from 31.6% to 35.1%. West Flanders is at 38.1%, but its interval touches the national one, as does that of Liege at 27.9% on 140 menus. We read both as about average. The other Walloon provinces each have fewer than 100 menus found: they are in the table, and we draw no conclusion from them.
| Province, region or venue type | Menu found | Only PDF or image | Share | 95% interval |
|---|---|---|---|---|
| Limburg | 229 | 100 | 43.7% | 37.4 to 50.1 |
| West Flanders | 465 | 177 | 38.1% | 33.8 to 42.6 |
| Flemish Brabant | 297 | 102 | 34.3% | 29.2 to 39.9 |
| Antwerp | 554 | 185 | 33.4% | 29.6 to 37.4 |
| Brussels | 301 | 96 | 31.9% | 26.9 to 37.4 |
| East Flanders | 491 | 152 | 31.0% | 27.0 to 35.2 |
| Hainaut | 74 | 21 | 28.4% | 19.4 to 39.5 |
| Liege | 140 | 39 | 27.9% | 21.1 to 35.8 |
| Walloon Brabant | 88 | 20 | 22.7% | 15.2 to 32.5 |
| Namur | 59 | 13 | 22.0% | 13.4 to 34.1 |
| Luxembourg | 36 | 7 | 19.4% | 9.8 to 35.0 |
| Flanders | 2,036 | 716 | 35.2% | 33.1 to 37.3 |
| Wallonia | 397 | 100 | 25.2% | 21.2 to 29.7 |
| Bars | 524 | 217 | 41.4% | 37.3 to 45.7 |
| Restaurants | 2,210 | 695 | 31.4% | 29.5 to 33.4 |
| All of Belgium | 2,734 | 912 | 33.4% | 31.6 to 35.1 |
By region the gap is clear. In Flanders 35.2% of 2,036 menus found sit only in a PDF or image, in Wallonia 25.2% of 397, in Brussels 31.9% of 301. The intervals for Flanders and Wallonia do not touch. Our reading rules also know French words such as carte, boisson and tarif, so a menu in French is found just as well.
Bars put their menu in a file more often than restaurants: 41.4% of 524 menus against 31.4% of 2,210, with intervals that do not touch. The venue type comes from OpenStreetMap, where whoever adds the place picks the tag, and bars here also covers cafes and pubs. The count does not tell us why Limburg or the bars read higher.
How to put your restaurant menu online
A menu on your site works when a guest can read it on a phone, and a search engine and a screen reader can too. That takes text on a page more than a big design.
- Publish the menu as plain text on its own page, with prices, and keep a PDF only as a printable extra.
- List the allergens per dish on that same page. Anyone with an allergy looks there before booking.
- Link that page from your Google Business Profile and pick the right category.
- Time the page on a phone with our speed test. When a heavy PDF or large photo slows it down, our guide to website speed shows the fix.
- Run the accessibility checker on it. A menu photo without text stays blank for a screen reader.
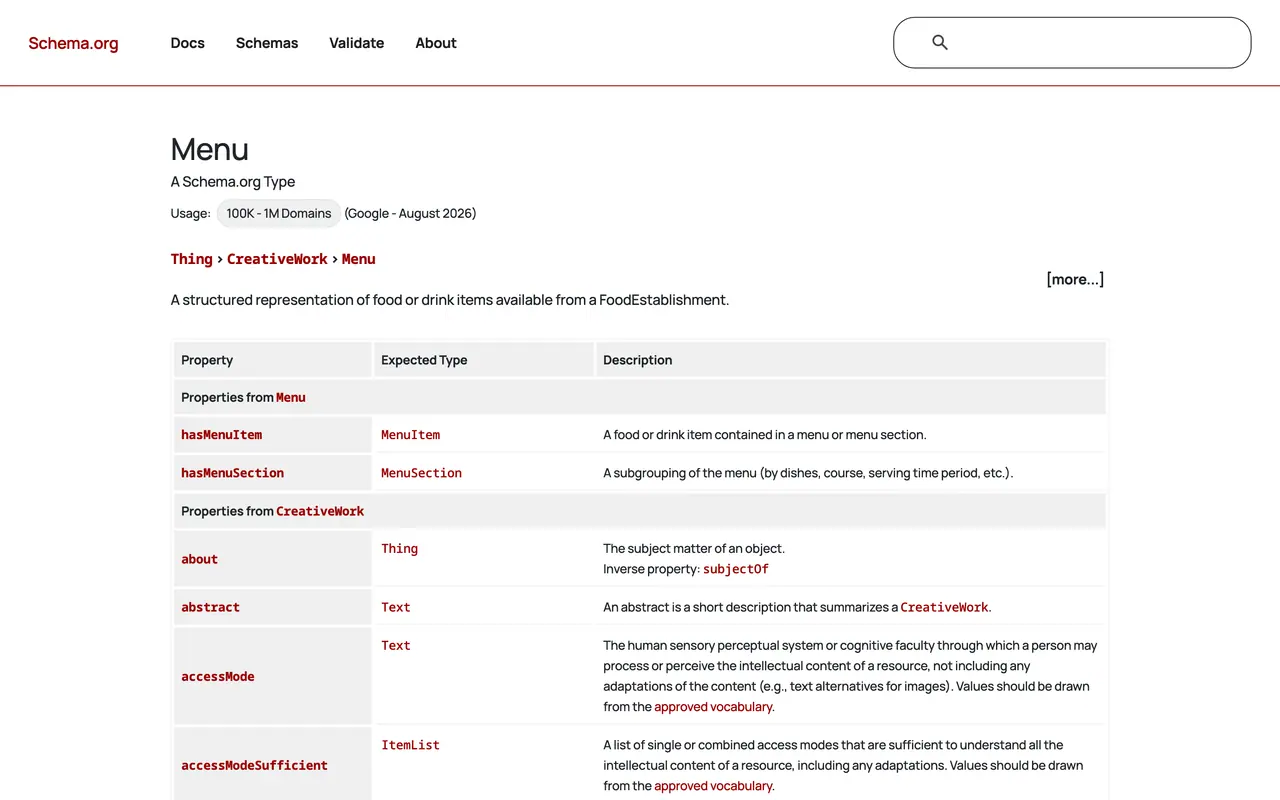
- Mark up your menu and opening hours as schema markup. Schema.org has its own Menu type, with sections and items, so search engines can recognise your menu as a menu.
- Take bookings on your own site with a booking system.
Changing a price then means editing a line, not making and uploading a new file. To see what a new site would run to, use the website cost calculator. A chatbot that answers questions about your menu needs a readable menu first, which is one theme of AI in hospitality.
The cost of a pint in Belgium: €3.10 on 396 menus
On the menus we could read, we logged three prices that almost every venue lists. A draught pils cost a median of €3.10 in November 2026, read from the own menus of 396 venues. The Flemish provinces and Wallonia sit close together at €3.00 to €3.20. Brussels reads €3.50 on exactly 30 menus: that is our floor, so treat it as a direction.
Half the menus ask less than that median and half ask more. These are prices that bars and restaurants publish on their own websites, so no survey and no delivery platform stands in between. Statbel, the Belgian statistics office, tracks price changes by product group for the whole country, while we read the amount on the menu itself.
The Flemish provinces sit close together, Brussels reads higher on 30 menus
Brusselsn = 30€3.50
Antwerpn = 94€3.20
Flemish Brabantn = 54€3.05
Limburgn = 48€3.05
East Flandersn = 63€3.00
West Flandersn = 75€3.00
Wallonia (region)n = 32€3.00
Euro per draught pils, median per group. Each venue counts once.
Each Walloon province has fewer than 30 menus, so they appear together as a region.
What you get for that money: 25 cl, not 568 ml
If you are visiting from the UK or Ireland, read the word pint with care. Belgians say pint or pintje for a standard glass of draught pilsner, and that glass is usually 25 cl. 153 of the menus we read state that size outright. An imperial pint is 568 ml, more than twice as much, so €3.10 for 25 cl works out at roughly €7 per imperial pint. Speciality beers and bottles are a different market, and we left them out.
By province, prices sit close together
Six of the seven groups have a median between €3.00 and €3.20. Brussels reads higher at €3.50: its middle half of menus runs from €3.20 to €4.00, while in every other group the middle half stops at €3.50 at most. Brussels is a region, not a province, and we list it beside the Flemish provinces and Wallonia as a whole.
| Province or region | Menus | Median | Middle half |
|---|---|---|---|
| Brussels | 30 | €3.50 | €3.20 to €4.00 |
| Antwerp | 94 | €3.20 | €3.00 to €3.50 |
| Flemish Brabant | 54 | €3.05 | €3.00 to €3.50 |
| Limburg | 48 | €3.05 | €2.98 to €3.40 |
| East Flanders | 63 | €3.00 | €3.00 to €3.50 |
| West Flanders | 75 | €3.00 | €2.85 to €3.50 |
| Wallonia (region) | 32 | €3.00 | €2.75 to €3.35 |
| All of Belgium | 396 | €3.10 | €3.00 to €3.50 |
None of the five Walloon provinces has 30 pint prices, so they count as one group. Brussels itself only just clears our floor at exactly 30, which is why the next table matters as much as this one.
How much weight the Brussels gap can carry
Brussels ranks first in 99.3% of 10,000 resamples of the menus. A second check is tougher: shuffle the province labels at random and a gap that wide still turns up in about 9 of every 100 rounds. So chance does not rule it out. That is why Brussels stays out of our headline: it is an observation on 30 menus that a larger count would have to confirm.
| Comparison | Median gap | 95% interval | Reading |
|---|---|---|---|
| Brussels against East Flanders | €0.50 | €0.10 to €1.00 | Brussels higher |
| Brussels against rest of Belgium | €0.50 | €0.30 to €1.00 | Brussels higher |
| Brussels against Antwerp | €0.30 | €0.05 to €0.80 | Brussels higher, narrowly |
| Antwerp against East Flanders | €0.20 | -€0.20 to €0.40 | about equal |
Within Flanders we see no real gap: Antwerp at €3.20 and East Flanders at €3.00 fall inside the noise. With restaurants alone Brussels stays higher, though at 21 menus that group is too small for a figure of its own. The mix of venues does not explain the gap either, because restaurants make up 70.0% of the Brussels menus and 60.3% to 77.3% in the Flemish provinces. The count does not tell us why Brussels reads higher.
Bars ask €3.00, restaurants €3.30
A glass on a bar's menu costs a median of €3.00, in a restaurant €3.30. The 30 cents are small but solid, with an interval from 20 to 40 cents over 115 bars and 281 restaurants. Coffee moves the same way, while spaghetti does not.
| Product | Bars | Median, bars | Restaurants | Median, restaurants | Gap, 95% interval |
|---|---|---|---|---|---|
| Draught pils | 115 | €3.00 | 281 | €3.30 | €0.20 to €0.40 |
| Coffee | 84 | €3.00 | 199 | €3.20 | €0.10 to €0.40 |
| Spaghetti bolognese | 67 | €17.50 | 236 | €17.85 | -€0.50 to €1.00 |
The venue label comes from OpenStreetMap, where whoever adds the place picks the tag. Bars here also covers cafes and pubs.
Around €18 in Flanders, €15.50 in Brussels and Wallonia together
Antwerpn = 88€18.00
Flemish Brabantn = 39€17.00
Limburgn = 32€17.50
East Flandersn = 43€17.90
West Flandersn = 66€17.50
Brussels and Wallonia togethern = 35€15.50
Euro per adult portion, median per group.
Brussels and Wallonia each have fewer than 30 menus on their own.
The price of a plate of spaghetti bolognese
Enough Belgian menus carry this dish to make it a yardstick: a median of €17.50 on 303 menus. Antwerp leads at €18.00 and Flemish Brabant closes the Flemish list at €17.00. That €1 gap passes the bootstrap, from 40 cents to €2.50, yet shuffled labels produce the same spread in about 37 of 100 rounds. Inside Flanders we call it about equal.
| Province or region | Menus | Median | Middle half |
|---|---|---|---|
| Antwerp | 88 | €18.00 | €17.00 to €19.92 |
| East Flanders | 43 | €17.90 | €15.90 to €19.00 |
| Limburg | 32 | €17.50 | €15.75 to €19.00 |
| West Flanders | 66 | €17.50 | €15.50 to €18.50 |
| Flemish Brabant | 39 | €17.00 | €15.75 to €18.50 |
| Brussels and Wallonia together | 35 | €15.50 | €13.45 to €16.95 |
| All of Belgium | 303 | €17.50 | €15.50 to €19.00 |
Neither Brussels nor Wallonia reaches 30 menus alone, so they share a line. Together they sit €2.45 below Flanders, which stands at €17.95 on 268 menus, with an interval of €1.50 to €4. Brussels thus reads higher on beer and falls in the lowest group on pasta. We draw nothing from that: the group is small and blends two regions.
Coffee stays near €3 everywhere
We added coffee because the counts carry it. A cup costs a median of €3.20 on 283 menus. Antwerp is 40 cents above East Flanders, but the interval touches zero, so that reads as about equal.
| Province or region | Menus | Median | Middle half |
|---|---|---|---|
| Antwerp | 64 | €3.40 | €3.00 to €3.82 |
| Brussels | 31 | €3.30 | €2.80 to €3.55 |
| Limburg | 40 | €3.20 | €3.00 to €3.50 |
| Flemish Brabant | 37 | €3.20 | €3.00 to €3.50 |
| East Flanders | 40 | €3.00 | €2.90 to €3.50 |
| West Flanders | 39 | €3.00 | €2.95 to €3.45 |
| Wallonia (region) | 32 | €3.00 | €2.95 to €3.50 |
Provincial capitals: no measurable premium
The capital of a province does not show a clear surcharge in these numbers. On sites with a postcode in OpenStreetMap, Brussels excluded, we set the provincial capitals against the rest of their province. For all three products the interval holds or touches zero.
| Product | Capital, menus | Capital, median | Rest, menus | Rest, median | Gap, 95% interval |
|---|---|---|---|---|---|
| Draught pils | 70 | €3.25 | 109 | €3.00 | €0.00 to €0.50 |
| Spaghetti bolognese | 36 | €17.25 | 110 | €17.85 | -€1.95 to €0.70 |
| Coffee | 43 | €3.40 | 90 | €3.00 | -€0.20 to €0.50 |
No single city reaches 30 menus. City against countryside stays unmeasured, since this frame has no reliable field for it.
Are these prices current?
Menus can sit untouched online for years. We can date about half of the pint prices, from the page header or the PDF properties. Dropping everything provably older than 2025 moves only the pint, by 10 cents.
| Product | All sites | Median | Without prices older than 2025 | Median |
|---|---|---|---|---|
| Draught pils | 396 | €3.10 | 373 | €3.20 |
| Spaghetti bolognese | 303 | €17.50 | 291 | €17.50 |
| Coffee | 283 | €3.20 | 263 | €3.20 |
Without the old menus Brussels drops to 29, under our floor, so in that reading it would get no median of its own; the direction holds. The price at the bar can still be higher than the one online, and we did not measure that distance.
The national index tells a different story
Statbel reports each month how prices move by product group across Belgium. That shows a rate of change without any amount per province. Our count shows an amount per group at one moment without any rate of change, so the two sit side by side.
| Statbel series | October 2026 against October 2025 |
|---|---|
| Restaurants, cafes and the like | +3.2% |
| Of which full service | +2.7% |
| Of which limited service | +4.9% |
| Inflation, all products | +5.26% |
Hospitality therefore rose more slowly than inflation that month, which went from 4.69% to 5.26%. Statbel lists natural gas, electricity and domestic heating oil among the most significant increases. The series say nothing about one glass of beer.
How this sits beside our earlier research
This count draws on the same frame as our study of Belgian business websites, in a narrower group. Our mobile study reports 7,443 sites in the hospitality sector; here only venues tagged restaurant, cafe, bar, pub or biergarten count, and 5,467 of those work, hence the different totals. That study and our measurement of website speed in Belgium look at what a visitor meets on the home page, and this one goes a step further to the menu. For what a website itself costs, see web design agency pricing.
What people look up about restaurant menus and beer prices
How do I put my restaurant menu online?
Publish it as plain text on its own page of your website, with prices and the allergens per dish, and link to it from your site's navigation and your Google Business Profile. A PDF can sit beside it for printing. A guest then reads it on a phone without opening a file.
Is a PDF menu a problem on a restaurant website?
A search engine can read a PDF with text, but a guest has to open a file and often zoom in. A PDF without text, such as a scan, is unreadable for any program. Of the 2,734 menus we found on Belgian venue sites, 556 exist only as a PDF: 20.3%.
How many restaurants have their menu online?
On 2,734 of the 4,983 Belgian hospitality websites we read in November 2026 we found a menu with prices or as a file: 54.9%. Another 462 sites have a menu page without prices, and on 1,576 we found no menu within five pages.
How much is a pint in Belgium?
A draught pils costs a median of €3.10 on 396 venues' own menus in November 2026. The glass is usually 25 cl, less than half an imperial pint. Half of all menus ask between €3.00 and €3.50.
How much is a pint of beer in Brussels?
A draught pils in Brussels costs a median of €3.50 on 30 menus, with the middle half from €3.20 to €4.00. That is 50 cents above the rest of Belgium. The group is only just above our floor, so read it as a direction.
What is the average price of a beer in Belgium?
We report the median, which is €3.10 for a standard draught pils. A median holds up better than an average because one expensive venue does not shift it. Speciality beers and bottles are not in this figure.
How much is a pint of Stella in Belgium?
We did not price Stella on its own. It counts in our draught pils figure along with brands such as Jupiler, Maes and Primus, where a menu lists it as the standard draught, and that median is €3.10.